Top 10% of Urban Indian Households has 7,517 Times the Assets of the Bottom Decile
 Published on Mar 23, 2023
Modified on Mar 24, 2023
Published on Mar 23, 2023
Modified on Mar 24, 2023
|
The average value of assets (AVA) of the top ten percent of urban households in India is more than seven thousand five hundred times greater than what the bottom ten percent owns. The AVA of the top decile was Rs. 1.5 crores, while the lowest decile owned an average of Rs. 2,000 of assets. The data is part of the All India Debt and Investment Survey – 2019, the survey for which was carried out between January-December, 2019 by the National Sample Survey Organization in its 77th round. Information on the assets and liabilities of households as of 30 June, 2018. The survey was spread over 5,940 villages covering 69,455 households in the rural sector and 3,995 blocks covering 47,006 households in the urban sector. Figure 1: Average value of Assets (000' Rs.) by decile class of asset holding Source: NSS Report no. 588: All India Debt & Investment Survey-2019, Ministry of Statistics & Programme Implementation
The chart shows the average value of assets per decile. Up till the fourth decile (30-40 percent) urban Indians are worse off than rural Indians, but from the fifth decile onwards the AVA of city dwellers starts outstripping rural residents. The survey suggests that rural households are better off than urban ones at the lower deciles. Rural inequality is not as stark as in urban areas. The difference between the top and the bottom declines is 198. Meaning the top 10 percent of rural households owns on average 198 times the assets of the bottom 10 percent. The AVA of the 10th decile of rural households is Rs. 81.17 lakh while households in the 1st decile hold on average Rs. 41,000. What about a breakdown by social group? The report has gathered caste-wise data on ownership of assets.
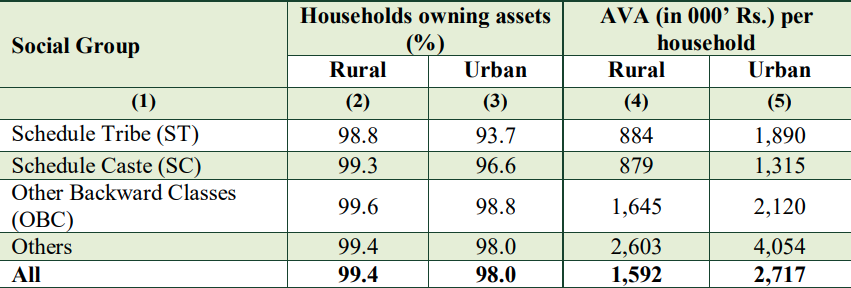
Table 1: Average Value of Assets by Social Group Source: NSS Report no. 588: All India Debt & Investment Survey-2019, Ministry of Statistics & Programme Implementation
The table above shows that Scheduled Castes (SCs) are the worst off when it comes to asset ownership. The average assets of a rural SC households are equivalent to Rs. 8.79 lakh, while the figure for urban households is Rs. 13.15 lakh. Scheduled Tribes (STs) are slightly better off at Rs. 8.84 lakh and Rs. 18.9 lakh respectively. Other Backward Classes (OBC) households in rural areas own twice the assets of SCs and STs, at Rs. 16.45 lakh while their urban counterparts own an average of Rs. 21.2 lakhs in assets. The Upper Castes, classified as ‘Others’ in the report, are the richest. Rural households own an average of Rs. 26.03 lakh while urban households own Rs. 40.54 lakh in assets.
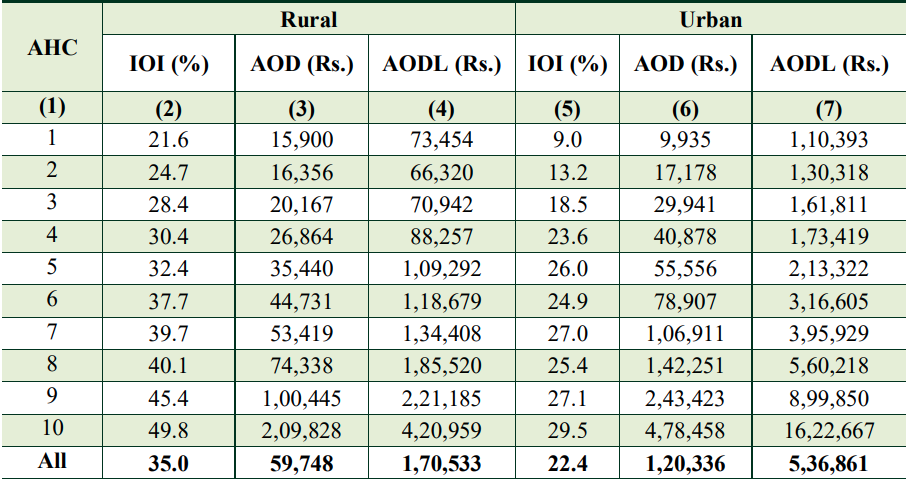
Table 2: Incidence of indebtedness (IOI), Average amount of Debt (AOD) per household & AOD per indebted household
Source: NSS Report no. 588: All India Debt & Investment Survey-2019, Ministry of Statistics & Programme Implementation
This table shows us that rural indebtedness is higher than urban indebtedness, with 35 percent of rural households reporting being in debt compared to 22.4 percent of urban households. However, the average amount of debt of rural households is lower than their urban counterparts: Rs. 59,748 (rural) and Rs. 1,20,336 (urban). References |
Inclusive Media for Change, 23 March, 2023
Tagged with: Average Value of Assets Debt Debt and Investment Indebtedness India Inequality National Sample Survey Organisation NSSO Oxfam Urban Poverty Wealth disparity


Write Comments