
Debunking the myth of APMCs regulating agricultural marketing in a real world
 Published on Oct 17, 2021
 Modified on Oct 20, 2021
|
When one of the three farm laws i.e., The Farmers’ Produce Trade and Commerce (Promotion and Facilitation) Act, 2020 was enacted last year, it was argued by its proponents that the legislation would allow the farmers to sell their produce (and the traders to purchase that produce) outside the Agricultural Produce Market Committee-APMC mandis after crop harvesting. In a way, that particular piece of legislation was enacted to end the so-called monopsony power of the APMCs and to encourage the creation of private mandis/ markets/ yards, as was envisaged in the earlier drafted Model Act on Agricultural Marketing i.e., the Model APMC Act of 2003. The recently enacted The Farmers’ Produce Trade and Commerce (Promotion and Facilitation) Act, 2020 clearly says that it is a legislation "to provide for the creation of an ecosystem where the farmers and traders enjoy the freedom of choice relating to sale and purchase of farmers’ produce which facilitates remunerative prices through competitive alternative trading channels; to promote efficient, transparent and barrier-free inter-State and intra-State trade and commerce of farmers’ produce outside the physical premises of markets or deemed markets notified under various State agricultural produce market legislations; to provide a facilitative framework for electronic trading and for matters connected therewith or incidental thereto." If one may recall, the Model Act on Agricultural Marketing, among other things, mentioned that "[t]here will be no compulsion on the growers to sell their produce through existing markets administered" by the APMC. Besides, under that proposed model Act, "[c]ommission agency in any transaction relating to notified agricultural produce involving an agriculturist is prohibited and there will be no deduction towards commission from the sale proceeds payable to agriculturist seller." So, the question that naturally arises in one's mind is, given the State APMC Acts, what is the de facto state of affairs related to agricultural marketing? The Situation Assessment Surveys (please click here and here) conducted by the National Statistical Office-NSO (erstwhile National Sample Survey Office-NSSO) answers that quite well. The newly released Situation Assessment Survey of Agricultural Households and Land and Livestock Holdings of Households in Rural India (NSS 77th Round) shows that most agricultural households sold their produce (except sugarcane) in the local markets. To whom did the farm households sell their crops? Let us consider the case of paddy, one of the most water guzzling crops whose production is often alleged to be encouraged by a higher minimum support price-MSP coupled with a higher share of its total production being procured vis-à-vis other crops by the state agencies/ Food Corporation of India (FCI). One can notice from table-1 that about 52.6 percent of paddy producing households reported sale of the crop during the first half of crop year 2018-19. Out of them, almost three-fourth reported major disposal at local markets (75.1 percent), followed by major sales to government agencies (7.3 percent), cooperatives (5.4 percent), private processors (3.6 percent) and APMC markets (3.2 percent). About 95.9 percent of sugarcane producing households reported sale of the crop during the first half of crop year 2018-19. Out of them, 37.6 percent reported major sales to private processors, followed by major disposal to cooperatives (20.7 percent), local markets (15.6 percent) and government agencies (10.1 percent). Over three-quarter (76.6 percent) of paddy producing households reported sale of the crop during the second half of crop year 2018-19. Out of them, most reported major sales at local markets (69.8 percent), followed by major sales to government agencies (13.3 percent), private processors (5.7 percent), cooperatives (3.4 percent), input dealers (2.9 percent) and APMC markets (1.7 percent). Almost 95.7 percent of sugarcane producing households reported sale of the crop during January 2019-June 2019. Out of them, 29.4 percent reported major sales to private processors, followed by major disposal at local markets (25.3 percent), government agencies (15.2 percent) and cooperatives (14.1 percent). Across the crops, one finds that there was almost negligible sale to the Farmer Producer Organisations (FPOs) by the farm households in crop year 2018-19. In the case of sugarcane, there was a small proportion (though not insignificant) of sale to the contract farming sponsors/ companies. Please consult table-1. Table 1: Percentage distribution of agricultural households that have reported sale of crops by agency of major disposal during July 2018-December 2018 and January 2019-June 2019
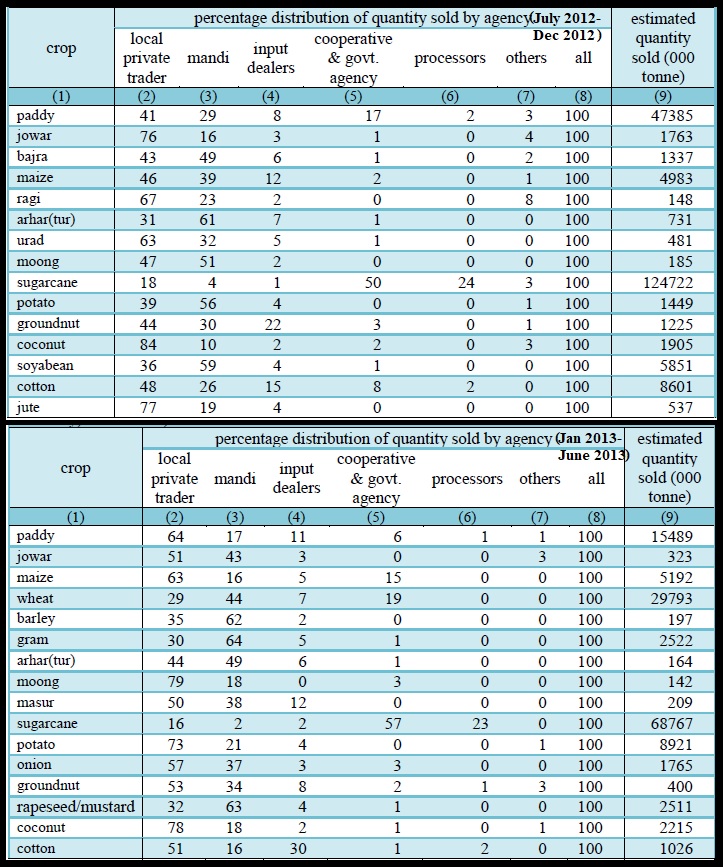
Source: Situation Assessment of Agricultural Households and Land and Livestock Holdings of Households in Rural India, 2019, NSS 77th Round, January 2019-December 2019, National Statistical Office (NSO), Ministry of Statistics and Programme Implementation (MoSPI), please click here to access Let us now find out to whom paddy was sold by farm households in crop year 2012-13. Table-2 shows that almost 56.9 percent of agricultural households, producing paddy, reported major sales to local private traders (i.e., 234 out of 411), followed by major disposal at mandis (19.5 percent), cooperatives and government agencies (9.5 percent) and input dealers (9.0 percent) during the first half of crop year 2012-13. Almost 42.7 percent of sugarcane farm households reported major disposal to cooperatives and government agencies (i.e., 376 out of 880), followed by major sales to processors (23.8 percent) and local private traders (21.8 percent) during July 2012-December 2012. Table 2: Number per 1000 of agricultural households reporting sale for selected crops during July 2012-December 2012 and January 2013-June 2013
Source: Key Indicators of Situation Assessment Survey of Agricultural Households in India (January-December 2013), NSS 70th Round, Ministry of Statistics and Programme Implementation, GoI, December 2014, please click here to access, please click here to access During January 2013-June 2013, nearly 72.1 percent of farm households reported sale of paddy crops to local private traders, followed by major sales at mandis (14.9 percent), input dealers (7.4 percent) and cooperatives and government agencies (4.4 percent). Almost 44.2 percent of sugarcane farm households reported major disposal to cooperatives and government agencies, followed by major sales to processors (27.0 percent) and local private traders (22.8 percent) during January 2013-June 2013. According to the SAS 2012-13 (NSS 70th Round), for all crops, except sugarcane, majority of the households sold off to either local private traders or mandis. For sugarcane, most of the farm households sold off to cooperatives and government agencies, processors and local private traders. The number per 1,000 of households reporting sale also indicates the fact that a major share of agricultural production in India is for own consumption. Percentage distribution of quantity of crop sold by farm households under major disposal by agency of disposal Table-3 shows the percentage share of the quantity of crops sold off to different agencies and their distribution by type of agency during the first and second halves of crop year 2018-19. Barring sugarcane, most amounts of various crops were sold (i.e., major disposal) at local markets. Take for example, the case of paddy once again. Around 59.3 percent of paddy crop was sold off (in terms of quantity) to different agencies in the first half of crop year 2018-19. Out of that, 63.4 percent was sold at local markets, followed by major disposal to government agencies (13.9 percent), APMC markets (8.4 percent) and cooperatives (7.8 percent). As opposed to paddy, roughly 96.9 percent of sugarcane crop (in terms of quantity) was sold off to different agencies. Out of that, 33.8 percent was sold to private processors, followed by major disposal to cooperatives (25.3 percent) and at local markets (12.6 percent). During the second half of crop year 2018-19, about 79.0 percent of paddy crop was sold off (in terms of quantity) to different agencies. Out of that, 61.8 percent was sold at local markets, followed by major disposal to government agencies (18.4 percent) and private processors (8.0 percent). Approximately 98.6 percent of sugarcane crop (in terms of quantity) was sold off to different agencies. Out of that, about 27.0 percent was sold to private processors, followed by major disposal to cooperatives (16.7 percent), government agencies (15.9 percent) and at local markets (15.8 percent) during January 2019-June 2019. Table 3: Percentage distribution of quantity of crop sold by agricultural households under major disposal by agency of disposal during July 2018-December 2018 and January 2019-June 2019
Source: Situation Assessment of Agricultural Households and Land and Livestock Holdings of Households in Rural India, 2019, NSS 77th Round, January 2019-December 2019, National Statistical Office (NSO), Ministry of Statistics and Programme Implementation (MoSPI), please click here to access --- Table-4 indicates that the majority of the production of various crops, except sugarcane, was sold off to either local private traders or mandis. In case of paddy, 41.0 percent of its quantity was sold to local private traders in the first half of crop year 2012-13, followed by major disposal at mandis (29.0 percent) and cooperatives and government agencies (17.0 percent). Around 50.0 percent of sugarcane crop (in terms of quantity that was disposed) was sold off to cooperatives and government agencies during July 2012-December 2012, followed by major disposal to processors (24.0 percent) and local private traders (18.0 percent). During the second half of crop year 2012-13, about 64.0 percent of paddy crop was sold off (in terms of quantity that was disposed) to local private traders, followed by major disposal to mandis (17.0 percent) and input dealers (11.0 percent). Nearly 57.0 percent of sugarcane crop (in terms of quantity that was disposed) was sold off to cooperatives and government agencies during January 2013-June 2013, followed by processors (23.0 percent) and local private traders (16.0 percent). Table 4: Percentage distribution of quantity sold by agency for selected crops during July 2012-December 2012 and January 2013-June 2013
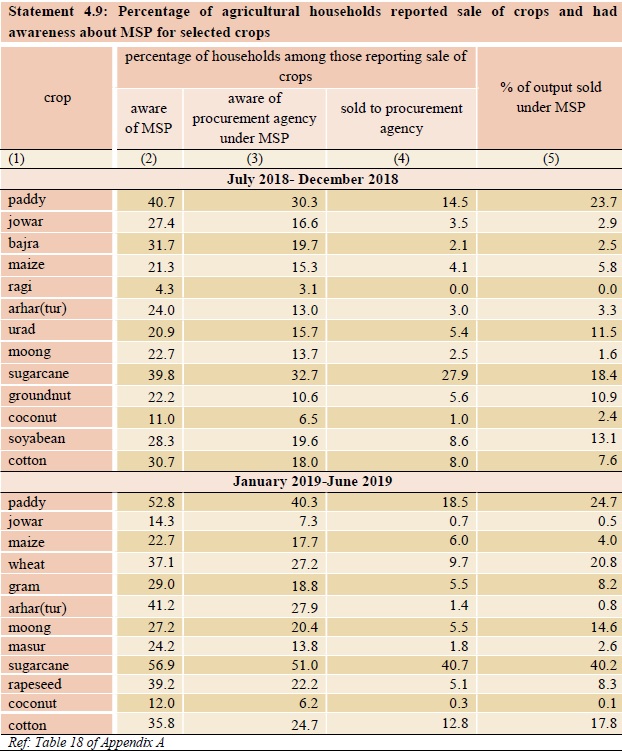
Source: Key Indicators of Situation Assessment Survey of Agricultural Households in India (January-December 2013), NSS 70th Round, Ministry of Statistics and Programme Implementation, GoI, December 2014, please click here to access, please click here to access --- The SAS 2012-13 report (NSS 70th Round) mentions that the lower share of sale to cooperatives and government agencies shows the lesser utilisation of procurement agencies which provide Minimum Support Price (MSP) to selected crops (barring sugarcane). Awareness of MSP and procurement agency under MSP The SAS 2018-19 report (NSS 77th Round) indicates that the percentage of crop output sold under MSP varied from almost zero percent for ragi to 23.7 percent in case of paddy during the period July 2018-December 2018. Likewise, in the 2nd half of crop year 2018-19, the percentage of crop output sold under MSP varied from almost 0.1 percent for coconut to 40.2 percent in case of sugarcane. While 40.7 percent of paddy selling farm households were aware of MSP during the first half of crop year 2018-19, in case of ragi selling households this figure was close to 4.3 percent. Likewise, 56.9 percent of sugarcane selling households were aware of MSP during the second half of crop year 2018-19, whereas in case of coconut selling households this figure was around 12.0 percent. Although 32.7 percent of sugarcane selling households were aware of the procurement agency under MSP during the first half of crop year 2018-19, in case of ragi selling households this figure was close to 3.1 percent. Similarly, 51.0 percent of sugarcane selling households were aware of the procurement agency under MSP during the second half of crop year 2018-19, while in case of coconut selling households this figure was roughly 6.2 percent. Although 27.9 percent of sugarcane selling households sold to procurement agencies during the first half of crop year 2018-19, in case of ragi and coconut selling households, the figures were zero percent and 1.0 percent, respectively. Similarly, 40.7 percent of sugarcane selling households sold to procurement agencies during the second half of crop year 2018-19, while in case of coconut and jowar selling households, the figures were 0.3 percent and 0.7 percent, respectively. The SAS 2018-19 (NSS 77th Round) had also ascertained the reasons for not selling to procurement agencies despite the farm households being aware about such agencies buying selected crops at MSP. Those reasons were: procurement agency not available, no local purchaser, poor quality of crop, crop already pre-pledged, received better price over MSP and others. The results of the SAS 2018-19 report (NSS 77th Round) are not different from what one got from a report entitled State of Indian Farmers, which was produced almost seven years back. The comprehensive nationwide study among farmer’s households spread across the country in 2013-2014 by Lokniti-CSDS (sponsored by Bharat Krishak Samaj) had found that the awareness about MSP, under which purchases are made from the farmers at rates declared by the Government of India, was low. Roughly 62 percent of the interviewed farmers were not aware about MSP, whereas just 38 percent had heard about MSP. Among those who had heard about MSP, most (64 percent) said that they were not satisfied with the rates for crops that are decided by the government and only 27 percent were satisfied with the rates of crops decided by the government. Besides, it was also observed that the farmers were not well informed about the schemes aimed for them and about the provisions made under those schemes.
References: Situation Assessment of Agricultural Households and Land and Livestock Holdings of Households in Rural India, 2019, NSS 77th Round, January 2019-December 2019, National Statistical Office (NSO), Ministry of Statistics and Programme Implementation (MoSPI), please click here to access Key Indicators of Situation Assessment Survey of Agricultural Households in India (January-December 2013), NSS 70th Round, Ministry of Statistics and Programme Implementation, GoI, December 2014, please click here to access, please click here to access The Farmers’ Produce Trade and Commerce (Promotion And Facilitation) Act, 2020, please click here to access Model Act on Agricultural Marketing/ the Model APMC Act of 2003, Ministry of Agriculture and Farmers' Welfare, please click here to access State of Indian Farmers: A Report (2013-14), prepared by Lokniti-CSDS, funded by by Bharat Krishak Samaj, please click here and here to access Press statement by Mahila Kisan Adhikaar Manch (MAKAAM) dated 30th September, 2020, please click here to access Number Theory: Understanding the business of farming in India -Abhishek Jha and Roshan Kishore, Hindustan Times, 29 September, 2021, please click here to access Most farmers sold to private traders in 2019, new survey data shows -Vignesh Radhakrishnan, Sumant Sen and Jasmin Nihalani, The Hindu, 14 September, 2021, please click here to access
Image Courtesy: Inclusive Media for Change/ Shambhu Ghatak |


Tagged with: #Cooperatives Agricultural Households Agricultural Produce Market Committee APMC Bypass Act APMC Mandis Coconut Cotton Farm Households Farm Laws FPOs Government Agencies Input Dealers Jowar Local Markets Millets Minimum Support Price MSP NSS 70th Round NSS 77th Round Oilseeds Paddy Private Processors Private Traders Pulses Ragi SAS Situation Assessment Survey Sugarcane The Farmers’ Produce Trade and Commerce (Promotion and Facilitation) Act, 2020 Wheat


Write Comments